Facebook has just posted its earnings for the quarter that ended March 31, 2013. Facebook hit $1.46 billion in revenue up 38% from Q1 2012, beating Wall Street estimates of sales of $1.44 billion.
Net income was up 7% to $219 million, versus $205 million a year ago (GAAP figures).
Mobile ad revenue for the quarter ending March 31, 2013 was $375 million, accounted for 30% of the company’s total ad revenues. That is up from 23% in the last quarter of 2012.
COO Sheryl Sandberg claimed that Facebook ads helped drive “25 million” app downloads. (Essentially, developers pay to promote their app inside a user’s Newsfeed. Click on the ad and go straight to Google Play or Apple’s App Store.) Zuckerberg added that, “I think it’s clear now that we can create a lot of value for [developers] by providing identity. We’re starting to see real revenue from mobile app installs.” The company said 40% of top-grossing iOS and Android apps were promoted on Facebook.
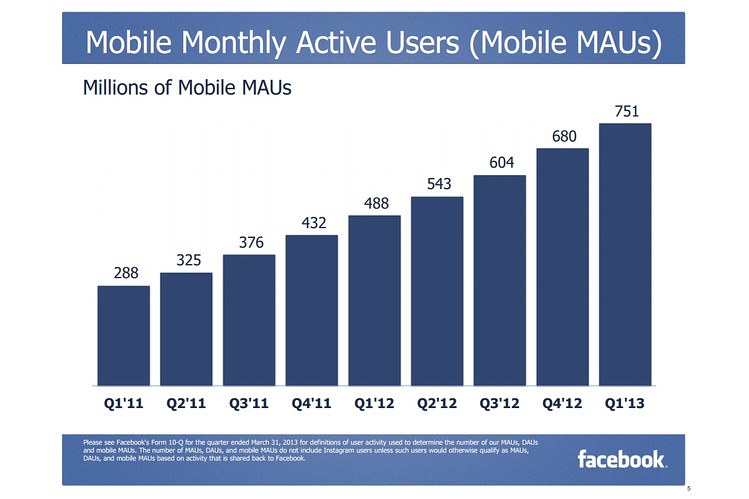
Facebook boasted 751 million mobile “monthly active users”– a 54% increase over the same quarter last year and 71 million more than it registered in the fourth quarter of 2012.
First Quarter 2013 Operational Highlights
First Quarter 2013 Financial Highlights
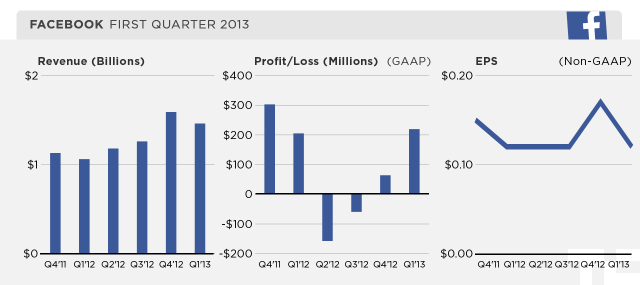
Revenue — Revenue for the first quarter totaled $1.46 billion, an increase of 38%, compared with $1.06 billion in the first quarter of 2012.
Costs and expenses — First quarter GAAP costs and expenses were $1.08 billion, an increase of 60% from the first quarter of 2012, driven primarily by infrastructure expense and increased headcount. Non-GAAP costs and expenses were $895 million in the first quarter, up 56% compared to $573 million for the first quarter of 2012.
Income from operations — For the first quarter, GAAP income from operations was $373 million, down 2% from $381 million in the first quarter of 2012. Excluding share-based compensation and related payroll tax expenses, non-GAAP income from operations for the first quarter was $563 million, up 16% compared to $485 million for the first quarter of 2012.
Operating margin — GAAP operating margin was 26% for the first quarter of 2013, compared to 36% in the first quarter of 2012. Excluding share-based compensation and related payroll tax expenses, non-GAAP operating margin was 39% for the first quarter of 2013, compared to 46% for the first quarter of 2012.
Provision for income taxes — GAAP income tax expense for the first quarter of 2013 was $134 million, representing a 38% effective tax rate. Excluding share-based compensation expense and related payroll tax expenses, the non-GAAP effective tax rate would have been approximately 43%.
Net income and EPS — For the first quarter, GAAP net income was $219 million, up 7% compared to net income of $205 million for the first quarter of 2012. Excluding share-based compensation and related payroll tax expenses and income tax adjustments, non-GAAP net income for the first quarter of 2013 was $312 million, up 9% compared to $287 million for the first quarter of 2012. GAAP diluted EPS was $0.09 in the first quarter of 2013. Excluding share-based compensation and related payroll tax expenses and income tax adjustments, non-GAAP diluted EPS for the first quarter of 2013 was $0.12, essentially flat compared to the first quarter of 2012.
Capital expenditures — Capital expenditures for the quarter were $327 million, a 28% decrease from the first quarter of 2012. Additionally, $11 million of equipment was procured or financed through capital leases during the first quarter of 2013.
Cash and marketable securities — Cash and marketable securities were $9.5 billion at the end of the first quarter of 2013.
Credits: ReadWrite, TechCrunch
Against the backdrop of a resilient macroeconomic environment and sector-specific growth dynamics, salary increment budgets…
The Tech Panda takes a look at recent funding events in the tech ecosystem, seeking…
For years, many founders believed that successful fundraising was about building the perfect pitch deck.…
The Tech Panda takes a look at recent launches in the superfast field of Artificial…
As the growth prospects of economies around the world battle against skyrocketing costs, geopolitical instability,…
India has been upping the game in investments as Indian startups forge ahead with new…